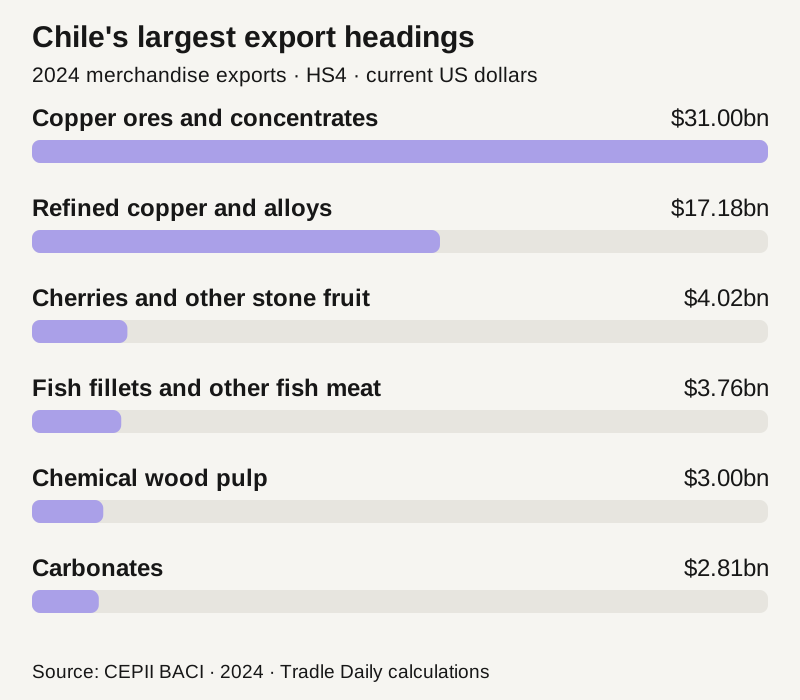
Chile's biggest goods exports are copper ores and refined copper. In the 2024 data used by Tradle Daily, those two headings alone account for about $48.18 billion, or 47.6% of the country's merchandise exports.
That is the short answer. The more interesting answer includes fruit, fish, wood pulp and wine. Together, they give Chile an export profile that is easier to recognise than the word “copper” suggests.
Our figures come from the project's processed CEPII BACI dataset, covering 2024 merchandise trade. The total for Chile is $101.24 billion. It is a goods-export total, not GDP, and does not include services.
Chile's largest export headings
| Export heading | HS4 code | 2024 value | Share of goods exports |
|---|---|---|---|
| Copper ores and concentrates | 2603 | $31.00bn | 30.6% |
| Refined copper and copper alloys, unwrought | 7403 | $17.18bn | 17.0% |
| Fresh apricots, cherries, peaches, plums and sloes | 0809 | $4.02bn | 4.0% |
| Fish fillets and other fish meat | 0304 | $3.76bn | 3.7% |
| Chemical wood pulp, soda or sulphate | 4703 | $3.00bn | 3.0% |
| Carbonates and peroxocarbonates | 2836 | $2.81bn | 2.8% |
| Unrefined copper and copper anodes | 7402 | $2.11bn | 2.1% |
| Frozen fish, excluding fillets | 0303 | $1.97bn | 1.9% |
| Molybdenum ores and concentrates | 2613 | $1.93bn | 1.9% |
| Wine and grape must within heading 2204 | 2204 | $1.63bn | 1.6% |
These are customs product headings, with some names shortened. They are not equally broad industries. “Fish fillets” covers several kinds of fish; “copper ores” describes a stage in a particular material's supply chain.
Why copper appears more than once
A copper ore shipment and a shipment of refined copper are different products, so trade classifications record them separately. That distinction matters when you read a treemap.
Adding the three copper headings in the table gives about $50.29 billion, or 49.7% of Chile's goods exports in this dataset. That is a useful subtotal, but not a complete measure of everything containing copper. Other copper products sit under other headings.
It also isn't a measure of copper's share of Chilean GDP. Export values count the goods crossing a border, not just the domestic value added in producing them.
The fruit and fish tell you something else
The third-largest heading in the table is a group of stone fruit that includes cherries. It would be tempting to label its entire $4.02 billion as “cherries”, but the HS4 data does not justify that. You need the more detailed subheadings to separate the fruits.
The same issue comes up with fish. Our headings distinguish fillets, frozen fish and fresh or chilled fish, rather than isolating salmon in every case. A chart that labels all of them “salmon” would be easier to read but less accurate.
For guessing a country, that broader information is still useful. Large copper exports accompanied by substantial fruit and fish exports give you a more specific pattern than a large minerals category alone. Wine and wood pulp add further detail.
Where is lithium in this table?
Lithium carbonate is included within heading 2836, the broader carbonates group. The heading also contains other compounds. Our HS4 total cannot be treated as a standalone lithium-export figure.
This is a common trap in country-export articles: a familiar commodity is used as the label for a larger group of products. It is worth checking the classification before comparing a number here with one in a news report.
How to use this in a country puzzle
Start with the biggest products, then check whether the supporting clues fit. Chile is a reasonable candidate for a chart led by copper ores and refined copper with visible fruit, fish and pulp. A copper-heavy chart without those supporting products might send you elsewhere.
Our Chile and Zambia comparison shows why even two copper-exporting countries can look different once you inspect the product mix and total value.
You don't need to remember that Chile's wine heading was $1.63 billion. Remembering that it appears alongside copper and food is much more useful.
Source and method
Data: CEPII BACI, HS22, year 2024, version V202601. We aggregate bilateral flows across importing partners and HS6 products into HS4 headings. Percentages use the unrounded $101,235,581,444 total; table values and percentages are rounded separately. This is a historical 2024 snapshot, not a claim about the latest monthly trade figures.
Download the exact figures. Adapted under the Etalab Open Licence 2.0. Dataset reference: Gaulier and Zignago (2010), BACI: International Trade Database at the Product-Level, CEPII Working Paper 2010-23.