A big copper rectangle is a useful clue. It isn't an answer.
Chile and Zambia both export a lot of copper. To tell them apart, it helps to look at the form that copper takes, the other products around it and the total value at the top of the chart. Those details are often more useful than recognising the biggest export on its own.
This guide is about that kind of reasoning. We make Tradle Daily, an independent export guessing game with five guesses per puzzle. OEC's original Tradle is a separate game. The general approach below works for export puzzles, but the interface, colours and rules described here are ours.
Read the area before the labels
An export treemap divides a rectangle into smaller rectangles. Each product's area represents its share of the export value being shown. A block worth twice as much gets twice the area, though it might be wider, taller or both.
In our overview, you see broad categories. Open one to see the products inside. The product view fills the available space, but its percentages still refer to all the country's merchandise exports, not just that category. A product taking up half the screen can therefore account for much less than half the country's exports.
Start with two questions: is one category doing most of the work, and what is the next substantial category? That gives you an initial shortlist before you spend a guess.
A worked example: Chile or Zambia?
Here are three copper headings from the same 2024 dataset used by the game. These are examples for learning, not clues to today's answer.
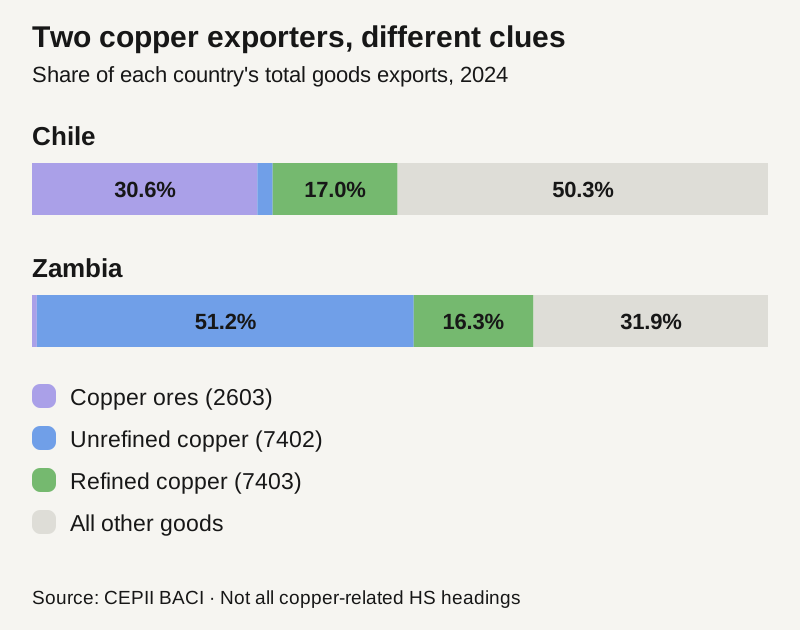
Chile's biggest of these headings is copper ores and concentrates. Zambia's is unrefined copper and copper anodes. The difference is worth noticing: a category called Minerals & Metals can conceal quite different products.
The totals provide another check. In our processed data, Chile exported about $101.24 billion of goods in 2024, compared with $14.52 billion for Zambia. If the mystery chart has a total near the first figure, guessing Zambia would ignore a valuable clue.
Then look beyond copper. Chile's leading export headings include stone fruit, fish fillets and wood pulp. Zambia's include nickel ores, unmanufactured tobacco and precious or semi-precious stones. You don't need to memorise every value. Remembering a combination is more useful than remembering a single commodity.
Make your first guess explain the chart
Before submitting, try finishing this sentence: “I think it is this country because...”
If your only reason is that you recognise the name, spend a little longer on the products. If you can point to two clues and a plausible export total, you have a useful hypothesis. It can still be wrong. The point is to make the feedback informative.
After a wrong guess, use both the distance and the direction. In Tradle Daily, distances are calculated between capital-city coordinates. They are not distances between the nearest borders, so neighbouring countries can still produce a substantial number of kilometres.
Avoid guessing every neighbouring country in turn. If the arrow and distance suggest a much longer journey, move your shortlist accordingly. Keep the export evidence in view while you do it.
Three traps worth remembering
Exports are not GDP. The total is the value of goods sold abroad in a year. It does not describe everything the economy produces, and this dataset excludes services such as tourism.
Exports are not necessarily local harvests or mining output. A country can import a material, process it and export it again. Switzerland's gold trade is a useful example. A gold-heavy chart does not automatically put you near a gold mine.
Colours belong to the game, not to a universal trade standard. Learn which categories the colours represent in the interface you are using. Don't carry a colour rule from another website without checking it.
Learn one thing from the reveal
When the answer appears, find the detail that would have helped most. Perhaps you missed a small but distinctive product. Perhaps the export total should have ruled out your first guess. That single observation gives you something concrete to use tomorrow.
For a closer look at one of the examples, read what Chile exports. Or try today's puzzle and see whether you can name two useful clues before guessing.
Data behind the example
Calculations use CEPII BACI, HS22, 2024, version V202601. We sum bilateral goods exports across destinations and aggregate HS6 products to HS4 headings. Values are current US dollars. Download the figures used here.
Source: CEPII BACI, adapted under the Etalab Open Licence 2.0. Dataset reference: Gaulier and Zignago (2010), BACI: International Trade Database at the Product-Level, CEPII Working Paper 2010-23.